The National Statistics Office (NSO), under the Ministry of Statistics and Programme Implementation (MoSPI), has released the 33rd edition of its annual publication, “Energy Statistics India 2026.” The report provides a technically rigorous dataset on India’s energy reserves, production, and trade. The primary finding indicates that India’s total Renewable Energy (RE) potential has reached 47,04,043 MW as of March 31, 2025. This expansion occurs alongside a steady growth in the Total Primary Energy Supply (TPES), which increased by 2.95% in FY 2024-25 to reach 9,32,816 KToE.
Solar Energy Dominance and Technical Revisions
Solar energy remains the dominant component of India’s green energy profile, accounting for approximately 71% of the total RE potential at 33,43,378 MW (33.43 lakh MW). This figure represents a massive upward revision of ground-mounted solar PV potential from the 748.98 GW estimated in 2014 to the current 3,343.37 GW.
According to the publication, this revision is driven by advanced assessment methodologies that moved beyond the “static land-use assumptions” used in 2014. Current assessments utilize high-resolution GIS mapping and geospatial data from the Indian Space Research Organisation (ISRO). The new methodology incorporates critical technical variables, including shading, latitude-specific performance, terrain constraints, and grid connectivity. The potential is calculated based on the identification of feasible wasteland, representing approximately 6.69% of the total identified wasteland. Additionally, a report by the National Institute of Solar Energy (NISE), released by Union Minister Pralhad Joshi, identifies a further 700 GW of potential from floating solar installations.
Regional Concentration of Renewable Potential
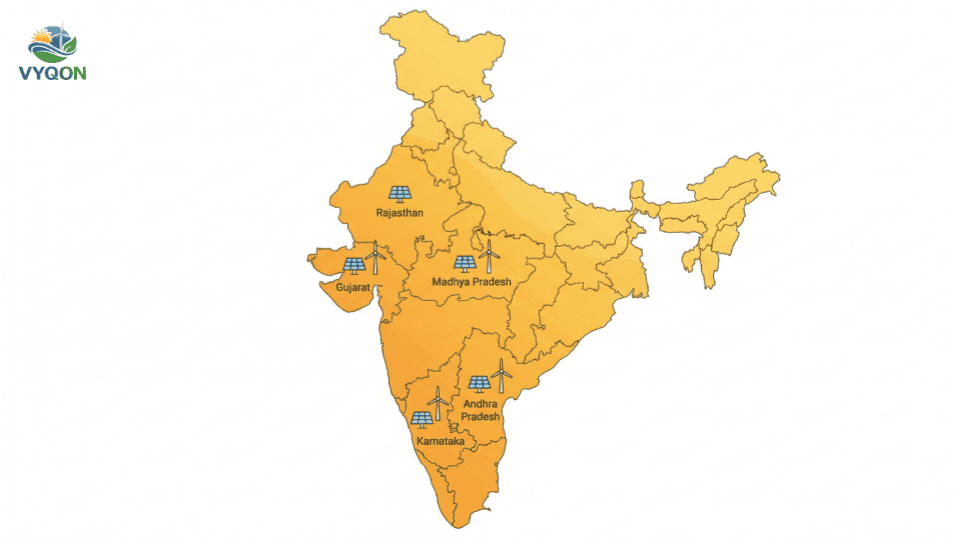
The data indicates a high geographical concentration of resources, with six states accounting for over 70% of the national total RE potential. The specific shares are:
- Rajasthan: 23.70%
- Maharashtra: 14.26%
- Gujarat: 9.10%
- Andhra Pradesh: 9.1%
- Karnataka: 8.59%
- Madhya Pradesh: 8.09%
Installed Capacity and Generation Trends
Longitudinal data reflects a robust expansion in infrastructure. India’s installed RE capacity grew from 90,134 MW in 2016 to 2,29,346 MW in 2025, representing a Compound Annual Growth Rate (CAGR) of 10.93%.
Output has mirrored this growth; gross electricity generation from renewable sources more than doubled, rising from 1,89,314 GWh in FY 2015-16 to 4,16,823 GWh in FY 2024-25. This reflects a steady CAGR of 9.17% for gross generation over the period.
Operational Efficiency and Consumption Metrics
The MoSPI report highlights significant gains in grid efficiency and an increase in domestic energy demand:
- Grid Efficiency: Transmission and Distribution (T&D) losses were reduced from approximately 22% in FY 2015-16 to 17% in FY 2024-25.
- Per Capita Consumption: Energy use per person increased from 15,296 Mega Joule/person in FY 2015-16 to 18,096 Mega Joule/person in FY 2024-25. This indicates a 30.41% surge in total final consumption and a per-capita CAGR of 1.89%.
Scaling Energy Infrastructure Finance
The report identifies a more than sixfold increase in credit flow to the energy sector, signaling aggressive infrastructure financing and heightened investor confidence.
- 2021: ₹1,688 crore
- 2025: ₹10,325 crore
Report Scope and Data Harmonization
“Energy Statistics India 2026” encompasses a broad scope of energy commodities, including coal, lignite, petroleum, natural gas, and renewables. A major technical achievement in this edition is the harmonization of sectoral end-use consumption statistics, which standardizes sectors across all commodities to ensure data consistency and comparability.
The 33rd edition introduces several enhanced analytical tools and datasets:
- Analytical Tools: Inclusion of Sankey Diagrams and Energy Balance tables for detailed flow visualization.
- New Data Streams: Credit flow to energy sub-sectors and consumption of domestic coal through e-auctions.
- Industrial Patterns: Detailed sub-sectoral industrial electricity consumption using Annual Survey of Industries (ASI) data.
- External Factors: Integration of international marine and aviation bunker data into domestic supply and consumption statistics.
Leave a Comment