
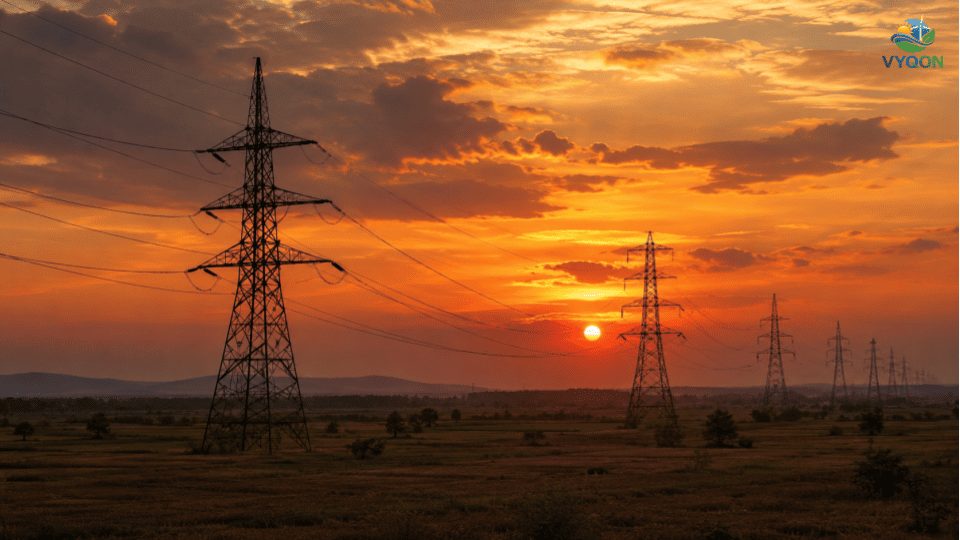
India’s solar fleet continues to grow faster than the power system’s ability to absorb its output. Grid-India data for September 2026 show that curtailment instructions covered a cumulative 96.9 GW of solar capacity during the month, along with 21.7 GW of wind capacity, taking the total renewable capacity affected to 118.6 GW. The monthly figures were compiled by JMK Research & Analytics from Grid-India’s daily variable renewable energy (VRE) reports and published on October 16, 2026.
The capacity figure is the sum of curtailed capacity reported on each day of the month, not the amount held back at any single point in time. It reflects how frequently and how widely back-down instructions were issued to solar and wind plants through September.
How Much Energy Was Lost
In energy terms, 378.52 million units (MU) of variable renewable generation was curtailed in September, equal to 1.28% of total renewable energy generation for the month. Solar accounted for about 314 MU, or 83% of the total, while wind accounted for 64.98 MU.
Compared with August, curtailed volume fell 43.31%, and the share of generation curtailed declined from 1.89% to 1.28%. The September figure was also 24% lower than in September 2025. However, the moderation reflects seasonal conditions rather than a structural improvement in grid integration, as curtailment had risen steeply in the preceding months.
Wind presents a contrasting trend. Wind curtailment nearly tripled year-on-year, raising its share of total curtailment from 4.7% to 17%.
System Balancing, Not Only Congestion
Grid-India records curtailment under two triggers. Real-time system constraints cover back-down instructions issued on the day to manage transmission congestion and network operating limits. Emergency Tertiary Reserve Ancillary Services (TRAS) Down involves reducing generation to balance supply and demand when the system cannot accommodate all available renewable output.
In September, 231.79 MU (61%) was curtailed under Emergency TRAS Down and 146.73 MU (39%) under real-time constraints. Solar made up about 82% of the energy curtailed through TRAS Down. The larger share of September’s curtailment was therefore driven by the need to keep supply and demand in balance during high-solar hours, rather than by transmission congestion alone.
Gujarat and Rajasthan Bear the Brunt
Curtailment remained concentrated in the two states with the largest renewable fleets. Gujarat recorded 187.76 MU (49.6% of the national total) and Rajasthan 110 MU (29.1%), together accounting for around 79%. Gujarat also contributed about two-thirds of all wind curtailment at 43.75 MU, while Rajasthan’s curtailment was entirely solar. Karnataka (21.07 MU) and Tamil Nadu (12.93 MU) followed, with solar dominating in Karnataka and wind in Tamil Nadu. Seven states are reported individually, and the remaining 15.75 MU came from other states.
MNRE data explains this concentration. As of September 30, 2026, Rajasthan led the country in installed solar capacity at 45,121.44 MW, followed by Gujarat at 36,234.55 MW. Gujarat also has the largest wind fleet at 17,043.76 MW and the highest total installed renewable capacity at 55,511.46 MW.
Capacity Additions Continue at Pace
India added 3,011.41 MW of solar and 680.75 MW of wind capacity in September, according to MNRE. Total renewable additions in the first half of FY2026-27 (April–September) reached 24,558.43 MW, comprising 20,790.76 MW of solar, 3,106.23 MW of wind and 650 MW of large hydro. Cumulative solar capacity reached about 171.05 GW, comprising 125.65 GW of ground-mounted plants, 33.41 GW of grid-connected rooftop systems, 6.63 GW of off-grid installations and 5.36 GW as the solar component of hybrid projects. Total renewable capacity, including large hydro, stood at about 299.25 GW.
The government has acknowledged the strain on the grid. In a written reply to the Rajya Sabha in July 2026, Minister of State for New and Renewable Energy Shripad Yesso Naik stated, based on information from Grid Controller of India Limited, that 8,133 GWh of solar power was curtailed during April–June 2026: 2,417 GWh in April, 3,235 GWh in May and 2,481 GWh in June. The reply attributed this to grid security requirements and a mismatch between the commissioning of transmission lines and renewable energy projects. These parliamentary figures come from a separate official dataset and are not directly comparable with the monthly VRE totals reported for September.
Role of Energy Storage
Battery energy storage systems (BESS) can absorb surplus midday solar generation and discharge it during the evening peak, directly addressing the balancing problem behind TRAS Down events. September’s curtailment averaged about 12.6 GWh per day, which corresponds in scale to roughly 3 GW of four-hour storage. Storage sited at constrained nodes in Gujarat and Rajasthan, and designed to respond to system operator signals, would deliver the greatest benefit.
Storage alone will not resolve the issue. Timely commissioning of inter-state transmission, more flexible operation of thermal units, improved renewable forecasting, demand shifting and market mechanisms that reward flexibility will need to progress in parallel.
Outlook
September offered short-term relief, but the underlying pattern remains unchanged. With solar capacity growing by several gigawatts every month, curtailment is likely to rise again as seasonal demand eases and midday surpluses widen. For developers, recurring back-downs mean lost generation and revenue; for the power system, they mean clean energy left unused. How quickly transmission, storage and grid flexibility keep pace with generation will determine whether India’s renewable expansion translates fully into delivered clean electricity.
Official Sources
- Grid Controller of India Limited (Grid-India) – Daily VRE and curtailment reports: https://grid-india.in/
- Ministry of New and Renewable Energy (MNRE) – Physical Progress (installed capacity as on 30.09.2026): https://mnre.gov.in/en/physical-progress/
- Rajya Sabha – Questions and Answers (MNRE written reply on solar curtailment, July 2026): https://sansad.in/rs/questions/questions-and-answers
Leave a Comment