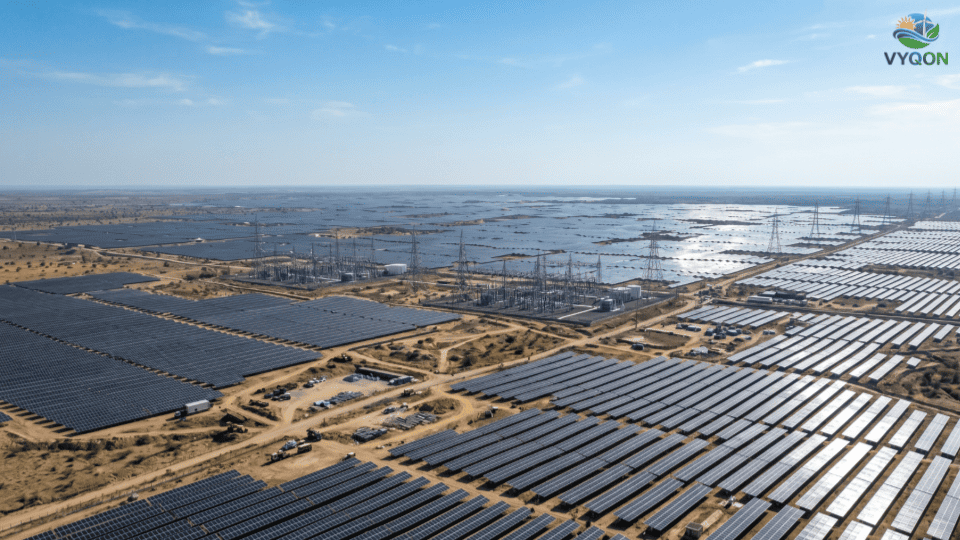
India has fundamentally redefined its energy trajectory, recording a historic 5 GW of solar capacity additions in April 2026. This momentum follows a transformative FY2025-26 (FY26), where the country confirmed a record total solar addition of 44.6 GW. While the single-month peak was established in March 2026 at 6.65 GW, the sustained high-performance in April signals that the sector has transitioned from intermittent growth to a high-velocity, institutionalized run-rate. These milestones have propelled India past Brazil to become the world’s third-largest country in terms of installed renewable energy (RE) capacity.
FY26 Performance Analysis and Capacity Breakdown
The solar sector witnessed a staggering 87% year-on-year growth in FY26, driven by a maturing project finance ecosystem and aggressive policy mandates. Total non-fossil fuel capacity has now reached 283 GW, accounting for 29.2% of the nation’s total power generation. This follows the landmark achievement of June 2025, where India reached the 50% installed capacity milestone from non-fossil sources—five years ahead of its Paris Agreement commitments.
FY26 Solar Capacity Breakdown
| Segment | Capacity Added (Approx.) | Key Growth Drivers |
| Ground-Mounted Solar | 35 GW | Utility-scale auctions; ISTS waiver; RTC/FDRE tenders |
| Rooftop Solar | 8.7 GW | PM Surya Ghar: Muft Bijli Yojana; rising C&I demand |
| Total FY26 Addition | 44.6 GW | 87% YoY Growth |
Regional Leaders and Strategic Mismatches
While capacity expansion is robust, it remains geographically concentrated. Rajasthan (maintaining a 27% national share), Gujarat, and Maharashtra continue to lead. However, this concentration is creating a “duck curve” effect in Rajasthan, where midday solar surges often lead to transmission overloads and a 5-10% curtailment rate.
A senior strategic concern is the “geographic mismatch” between generation-rich states in the West/South and “Deficit Regions” in the North and East, specifically Delhi-NCR, West Bengal, and Bihar. Addressing this requires a massive ₹2,442 billion (€26.86 billion) investment to build 50,890 circuit kilometers (ckt km) of new Inter-State Transmission System (ISTS) lines.
Policy and Manufacturing Tailwinds
- Domestic Supply Chain: The 40% Basic Customs Duty (BCD) and ALMM framework have successfully incentivized upstream investment, with 65 GW of integrated wafer-to-module capacity expected to be operational by 2026–2027.
- Incentive Extensions: The ISTS waiver has been strategically extended through 2028 for pumped storage and solar-plus-battery projects, a vital move for stabilizing the grid.
The Path to 500 GW and Infrastructure Requirements
To reach the national target of 500 GW of non-fossil capacity by 2030, and the subsequent 372 GW solar utility-scale target by 2032, India must maintain a rigorous annual addition of 38 GW from 2026 through 2032.
2032 Investment & Infrastructure Outlook
- Annual Investment Requirement: Estimated at US$ 17–28 billion.
- Benchmark Capital Costs: Stabilized at US$ 550–650/kW.
- Grid Expansion: Requirement for 8,120 ckt km of HVDC lines and 433,575 MVA of substation capacity.
The Storage Mandate
The market is shifting focus from “tendering” to “execution” to close the massive storage gap. As of March 2024, India possessed only 4.7 GW of Pumped Hydro and 219 MWh of Battery Energy Storage Systems (BESS). By 2030, the requirement balloons to 60.63 GW (including 41.65 GW from BESS), representing a total energy energy storage need of 336.4 GWh. A critical milestone in this transition is the 3,530 MWh BESS project in Gujarat, scheduled for commissioning in March 2026.
Market Dynamics and Institutional Risk Framework
Solar tariffs have found a floor at ₹2.20–2.50/kWh, creating a stable environment for institutional capital. The “next frontier” lies in Round-the-Clock (RTC) and Firm and Dispatchable Renewable Energy (FDRE) tenders, which offer higher yields and greater grid stability. Furthermore, the Carbon Credit Trading Scheme (CCTS) is expected to provide an additional revenue layer for developers by 2027–2028.
Risk Assessment for Institutional Investors
| Risk Category | Severity | Primary Mitigation Lever |
| Offtaker/DISCOM Credit | High | LC/Escrow mechanisms; SECI/NTPC central offtake |
| Grid Curtailment | High | ISTS connectivity; state-level grid assessments |
| Land Acquisition | Medium | Solar park procurement models; land bank partners |
| Tariff & Revenue | Medium | Long-tenor fixed PPAs; C&I diversification |
Equity IRR Benchmarks:
- Utility-Scale (Base): 13% – 16%
- Hybrid/BESS (with VGF): 14% – 18%
The 5 GW addition in April 2026 marks a watershed moment in India’s transition to an institutional-grade asset class. By successfully integrating domestic manufacturing via the Production Linked Incentive (PLI) scheme and addressing grid flexibility through storage-linked tenders, India is de-risking its path to 500 GW. The government’s continued commitment to the National Green Hydrogen Mission and its PANCHAMRIT climate goals provides the long-term policy certainty required to sustain this unprecedented scale of capital allocation.
Leave a Comment