
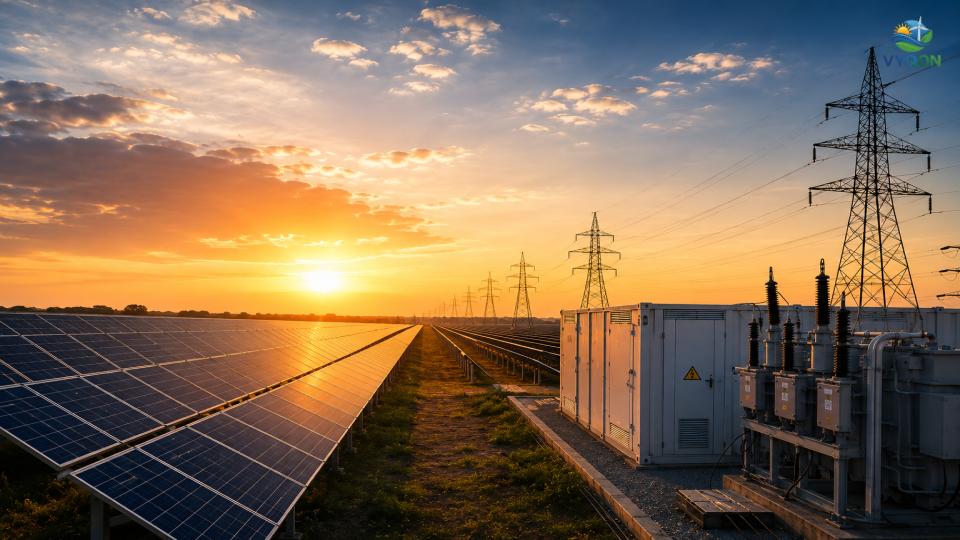
In the first half (H1) of 2026, the Indian solar photovoltaic (PV) market recorded its strongest installation period to date, adding 27 GW of new capacity.
H1 2026: Macro-Level Capacity Additions
During the period spanning January to June 2026, India installed 27 GW of solar PV capacity, eclipsing the 18 GW installed during the corresponding period in 2025.
- Total Energy Mix Dominance: Solar PV dominated India’s energy transition during this period, accounting for 76% of the 35.8 GW of total new power generation capacity added across all energy sources (including thermal, wind, and hydro) nationwide.
- Quarterly Distribution: The H1 total was heavily front-loaded by an explosive first quarter (Q1), which saw an all-time record of 15.3 GW commissioned. Q1 installations were 143% higher than the 6.3 GW added in Q1 2025, and 49% above the 10.3 GW installed in Q4 2025.
Q2 2026: Segment Performance and Geographic Distribution
While trailing the Q1 peak, the second quarter of 2026 remained robust, recording the second-highest quarterly solar capacity addition in India’s history at 11.7 GW.
- Quarter-on-Quarter (QoQ) and YoY Metrics: Q2 2026 installations declined by 24% QoQ from the 15.3 GW benchmark set in Q1, but registered a marginal 1% YoY increase compared to the 11.3 GW commissioned in Q2 2025.
Utility-Scale vs. Distributed Solar (Q2 2026)
- Utility-Scale Performance: Large-scale solar installations totaled 7.9 GW, accounting for 68% of all solar installations during the quarter. This segment experienced a notable slowdown, tracking a 37% QoQ decline (compared to 12.6 GW in Q1 2026) and a 23% YoY decline (compared to 10.2 GW in Q2 2025).
- Rooftop Performance: Rooftop solar installations made up a 33% share of the quarterly market, adding approximately 4 GW of capacity.
State-Level Utility-Scale Distribution (Q2 2026)
The execution of large-scale projects remained highly concentrated. The top 10 states accounted for 98% of all utility-scale capacity commissioned during Q2.
- Gujarat: Captured the largest market share, accounting for 40% of all utility-scale installations.
- Rajasthan: Secured the second position with a 19% share.
- Maharashtra: Followed closely with a 17% share of Q2 capacity additions.
Cumulative National Metrics (As of June 30, 2026)
The record H1 additions elevated India’s cumulative installed solar PV capacity to 164.8 GW at the end of June 2026. This solar base anchors India’s total non-fossil fuel capacity, which reached 300.5 GW by July 31, 2026, according to concurrent data from the Ministry of New and Renewable Energy (MNRE).
- Capacity Breakdown: Utility-scale projects represent 83% of the installed solar base. Rooftop solar assets account for the remaining 17%.
- Grid Penetration: Solar PV currently comprises 30% of India’s total installed power capacity and constitutes 57% of the nation’s total installed renewable energy capacity.
All-Time Cumulative State Market Share
- Rajasthan: Remains the dominant market leader, hosting 31% of the country’s cumulative utility-scale solar capacity.
- Gujarat: Ranks second with a 22% cumulative share.
- Karnataka: Retains the third position with an 11% share of total installations.
Primary Regulatory Drivers for the H1 Commissioning Surge
The 27 GW deployment in H1 2026 was largely an acceleration driven by developers advancing project execution timelines to precede two critical regulatory enforcement dates:
ALMM List-II Implementation: The June 1, 2026 deadline for the Approved List of Models and Manufacturers (ALMM) List-II heavily influenced project timelines. This mandate strictly requires the use of ALMM-compliant, domestically manufactured solar cells in modules utilized for government-backed and open-access projects. Developers rushed to commission assets to avoid anticipated domestic cell shortages and premium pricing.
Transmission Waiver Phasedown: Projects were accelerated to meet the Inter-State Transmission System (ISTS) charge phase-out deadline. The government’s ISTS charge waiver for renewable projects was scheduled to drop from 75% to 50% starting in July 2026, a policy shift that materially impacts the long-term project economics of future commissioning schedules.
Project Pipeline Contraction and Procurement Data
In direct contrast to the commissioning records, Mercom’s technical data reveals a sharp, simultaneous contraction in the future project pipeline.
- H1 2026 Pipeline Metrics: Large-scale solar tenders fell by 54% YoY, dropping to 11 GW from 24 GW in H1 2025. Project auctions experienced an even steeper decline, plunging 59% YoY to 5 GW, down from 13 GW.
- Q2 2026 Pipeline Metrics: In the June quarter specifically, agencies issued just 5 GW of utility-scale capacity tenders, reflecting a 6% QoQ and 22% YoY decline. Auctioned capacity in Q2 fell to roughly 2 GW, registering a 56% QoQ and 40% YoY drop, as the market shifted focus entirely toward executing previously awarded capacity.
- Current Backlog: The total large-scale project pipeline at the end of June 2026 stands at a massive 208 GW. An additional 151 GW of capacity has been tendered and is currently awaiting auction execution.
Structural Supply Chain Constraints
According to Mercom India Research, the steep contraction in procurement and the QoQ drop in utility-scale installations are directly attributed to acute equipment shortages and grid bottlenecks. Mercom Capital Group explicitly noted that the 208 GW project pipeline will not translate into commissioned capacity at forecasted levels unless these constraints are resolved.
- Domestic Cell Shortages and ALMM Pressure: The implementation of ALMM List-II has added severe pressure on domestic cell supply. There is a documented shortage of domestically manufactured TOPCon (Tunnel Oxide Passivated Contact) cells, which has limited ALMM-compliant module availability and elevated component prices, directly disrupting procurement and project planning.
- BOS Component Procurement Delays: The supply chain for Balance of System (BOS) equipment is strained. Industry reports highlight a severe procurement lag for grid transformers, with current delivery waiting periods extending up to eight months.
- Land and Transmission Gridlock: Persistent challenges related to land acquisition and limited inter-state transmission network availability remain critical barriers, slowing the pace at which utility-scale projects can secure connectivity approvals.
Future capacity additions moving into the second half of 2026 and early 2027 will hinge strictly on the resolution of these equipment availability issues, transmission readiness, and the commercial viability of executing the 208 GW backlog under original cost assumptions.
References :
MNRE — Solar capacity as of June 30, 2026: Official MNRE Physical Achievements
Mercom India: Q2 and 1H 2026 India Solar Market Update
Leave a Comment